While Bitcoin and Ethereum have moved their respective prices up the ladder over the past week, XRP was still struggling to start their engines. Marking only a 3.11% growth over the past week, when Bitcoin and Ethereum clocked over 6%, meant XRP wasn’t really in the bullish rally yet. However, signs were there for an imminent change.
XRP 4-hour chart
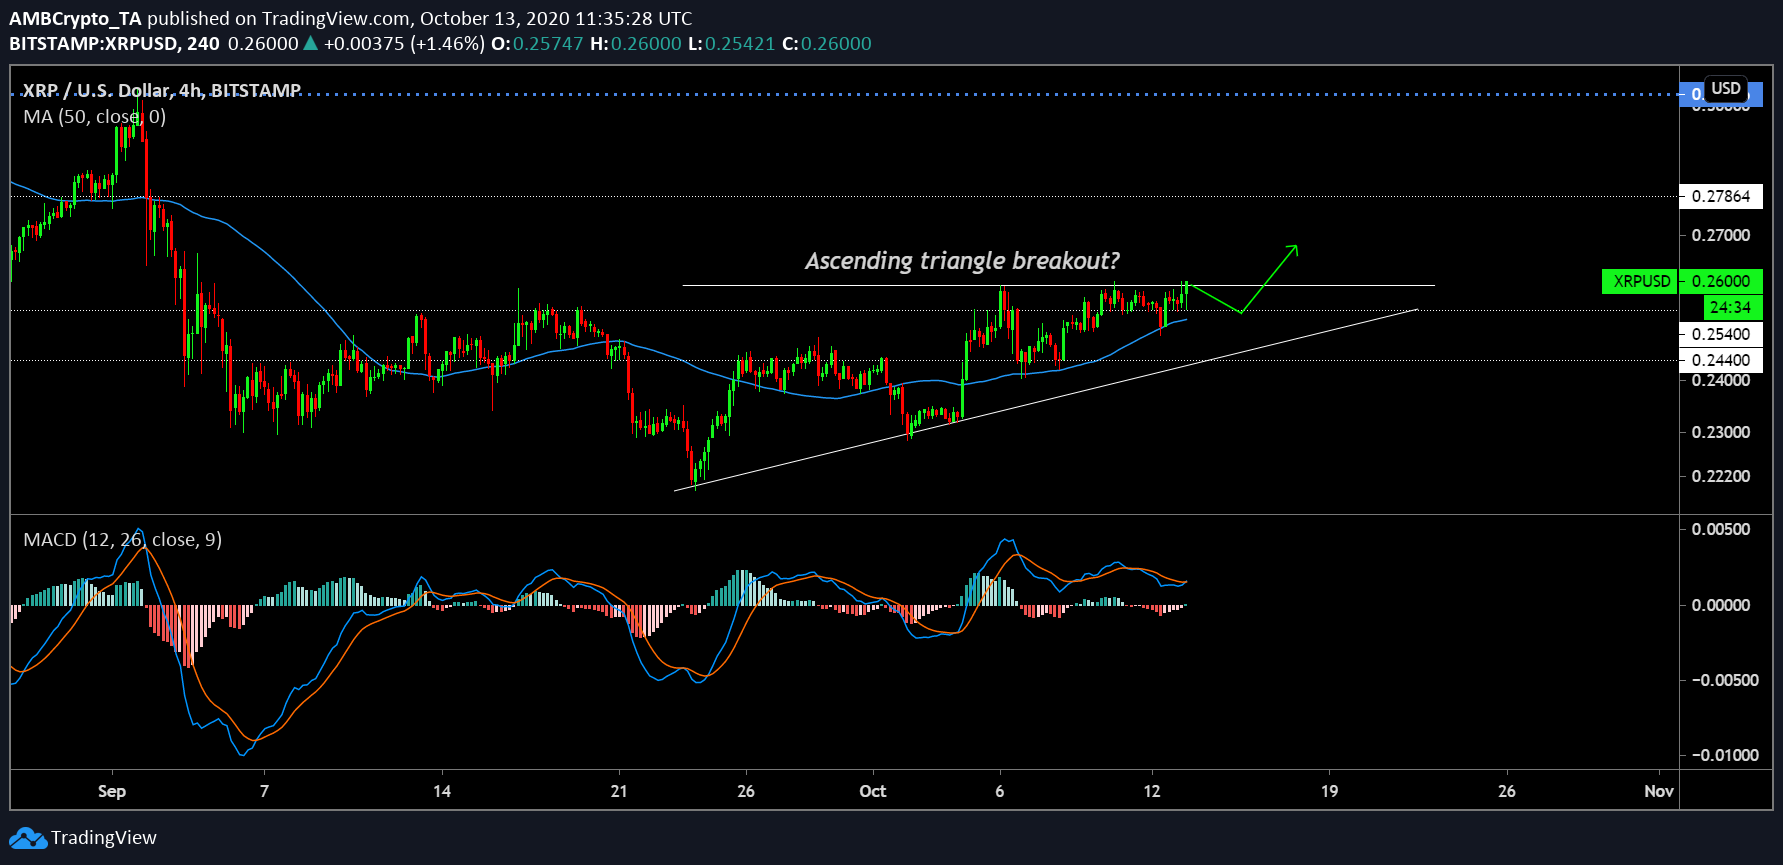
While a 4-hour chart might not tell the immediate trend over the next few hours, it is currently indicative of a trend breaking out in the next 24-48 hours. As observed, the price is currently emulating an ascending triangle pattern, which might undergo a strong bullish break at any moment. While the price has significant support for the 50-Moving Average since the start of last week, the price might slide slightly down to $0.254 again, before take-off.
The MACD indicator also suggested that the blue line is itching for a bullish crossover with the orange line, signaling a strong pump upwards.
XRP 1-hour chart
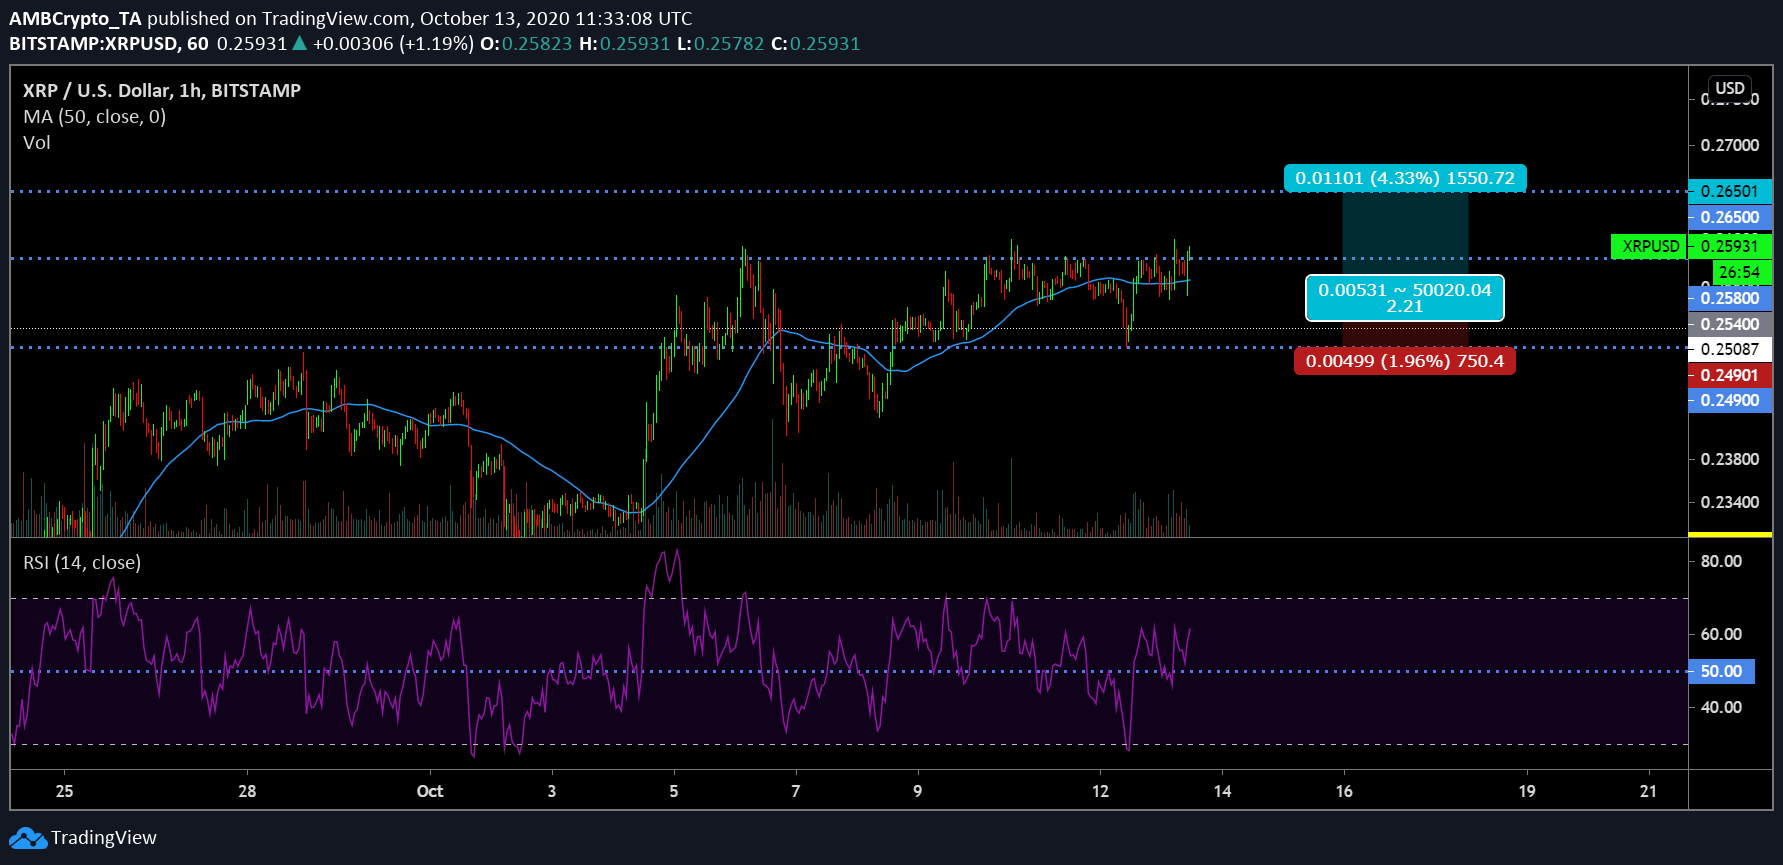
Now, reducing the time frame, on the 1-hour chart, a little bit of choppiness is still prevalent as the breakout hasn’t been completely bullish yet. While the 1-hour price is also taking support from the 50-Moving Average, it is maintaining close proximity with the MA. Hence, before the bullish move kicks in, XRP might take a minor dip, to strengthen the support at $0.254.
A long-position can be opened at $0.254 or $0.257 if the price only moves down by a minimal percentage, with a stop-loss position at the 1st support of $0.249. A take profit can be placed at $0.265, which is the immediate target of the token following a rally. The Risk/Reward Ratio clocks in at 2.21x for the trade.
However, the Relative Strength Index or RSI needs to keep in mind as the indicator must not fall below the 50 range. The buyers need to maintain a higher pressure than sellers for the token to eventually reflect the collective bullish proceedings.
The post appeared first on AMBCrypto


