Despite being at the bears’ mercy in 2019, XRP noted spurs of growth in recovery. After falling over 17% in the month of August, September carried winds of change for the coin as XRP is recording bullish momentum in the market. XRP’s price noted an upsurge of over 4% on September 7 resulting in a reversal of bearish trend.
The current advancing market may find some resistance in the short term but is expected to recover as a breach of a bullish pattern appears imminent.
6-hour

Source: Trading view
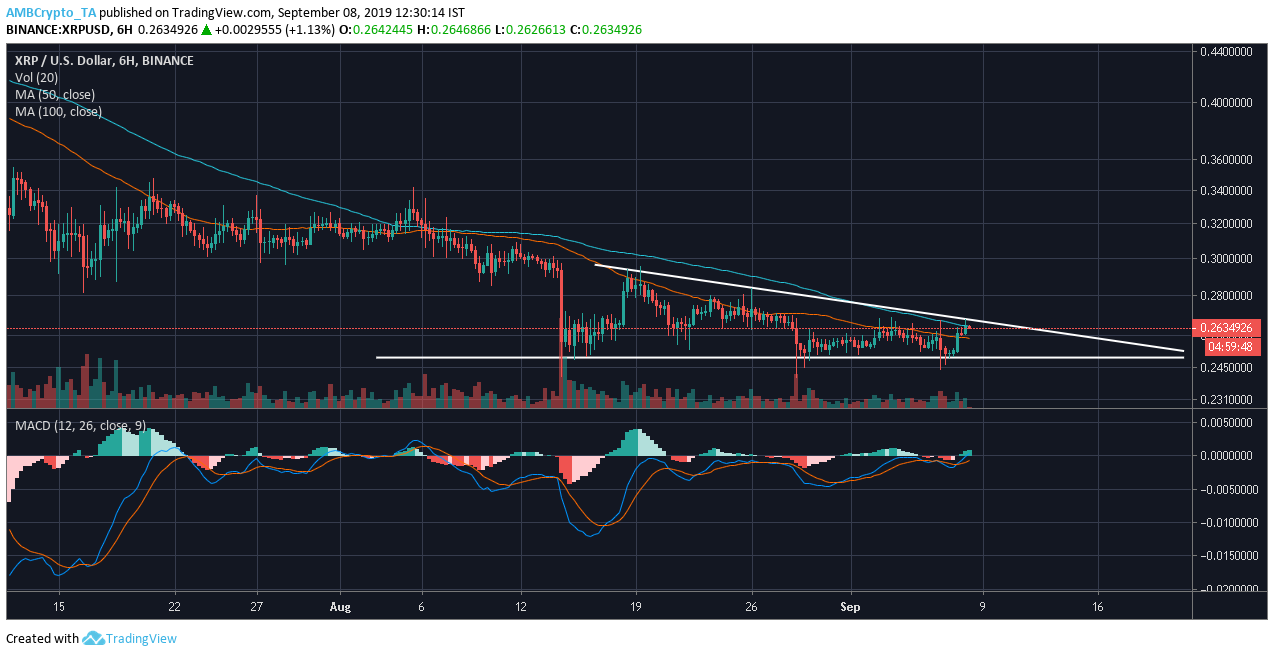
XRP’s 6-hour chart suggested a formation of a descending triangle pattern. The pattern is defined by two trend lines- one which bridges a series of lower highs at $0.2940, $0.2839, and $0.2680 and the other horizontal line that connects a series of lows at $0.2495. Conceived as a bearish pattern, the breakout is likely to take place, even as the price of XRP further consolidates.
The Moving average reasserted the upcoming fall as the 50 moving average was beneath the 100 moving average for 64 uninterrupted days. XRP dropped by 27.96% within this period. The lines do not appear to be converging anytime soon indicating a continued unfavorable market.
12-hour

Source: Trading view
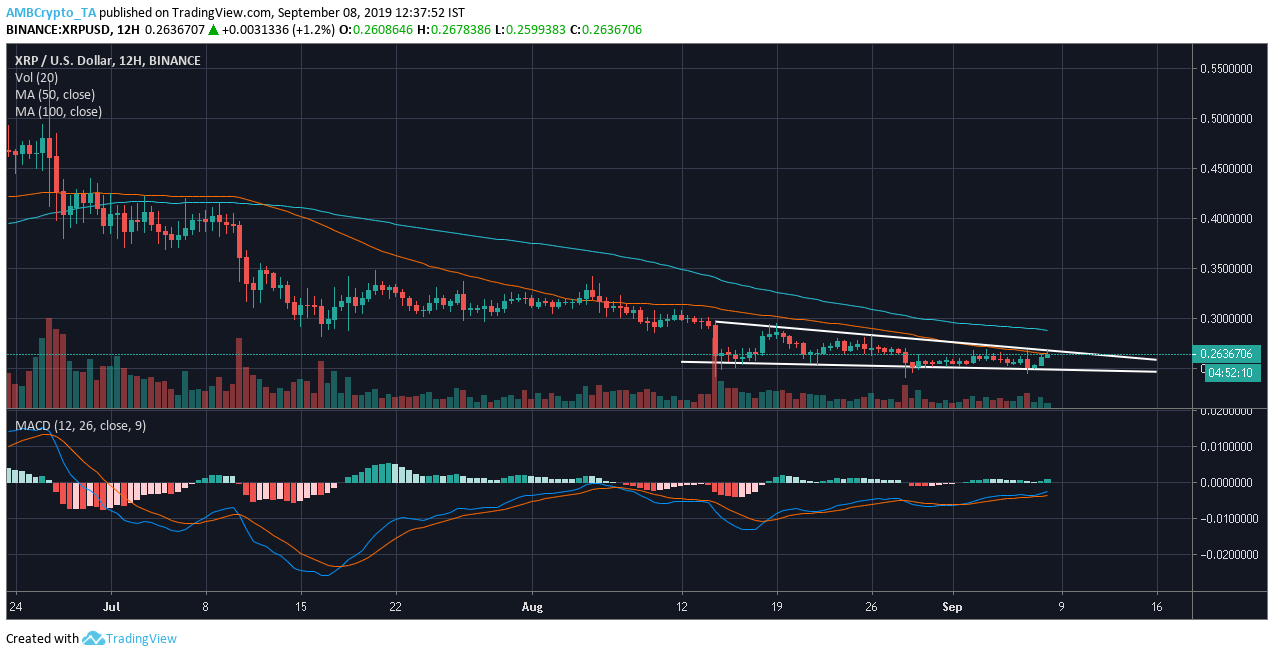
XRP’s 12-hour chart paints a bullish picture with the formation of a falling wedge. The price of XRP had been declining over time and the trend lines of the falling wedge have marked lower highs and consecutive lows, tapering. A reduced momentum and volume have slowed the rate of decline, resulting in an upswing of the XRP’s price.
The 100 moving average beats the 50 moving average as it has had an upper hand for the past 57 days resulting in a 20.97% fall of XRP. However, the MACD indicator reflects strengthening bullish momentum. MACD line has taken over the signal line, re-instating the presence of a dormant bull who may become active as XRP breaches the falling wedge.
Conclusion
The XRP price may take another hit with the breach of the descending triangle but is expected to recover in the longer term as the price consolidates within the falling wedge.
The post appeared first on AMBCrypto


