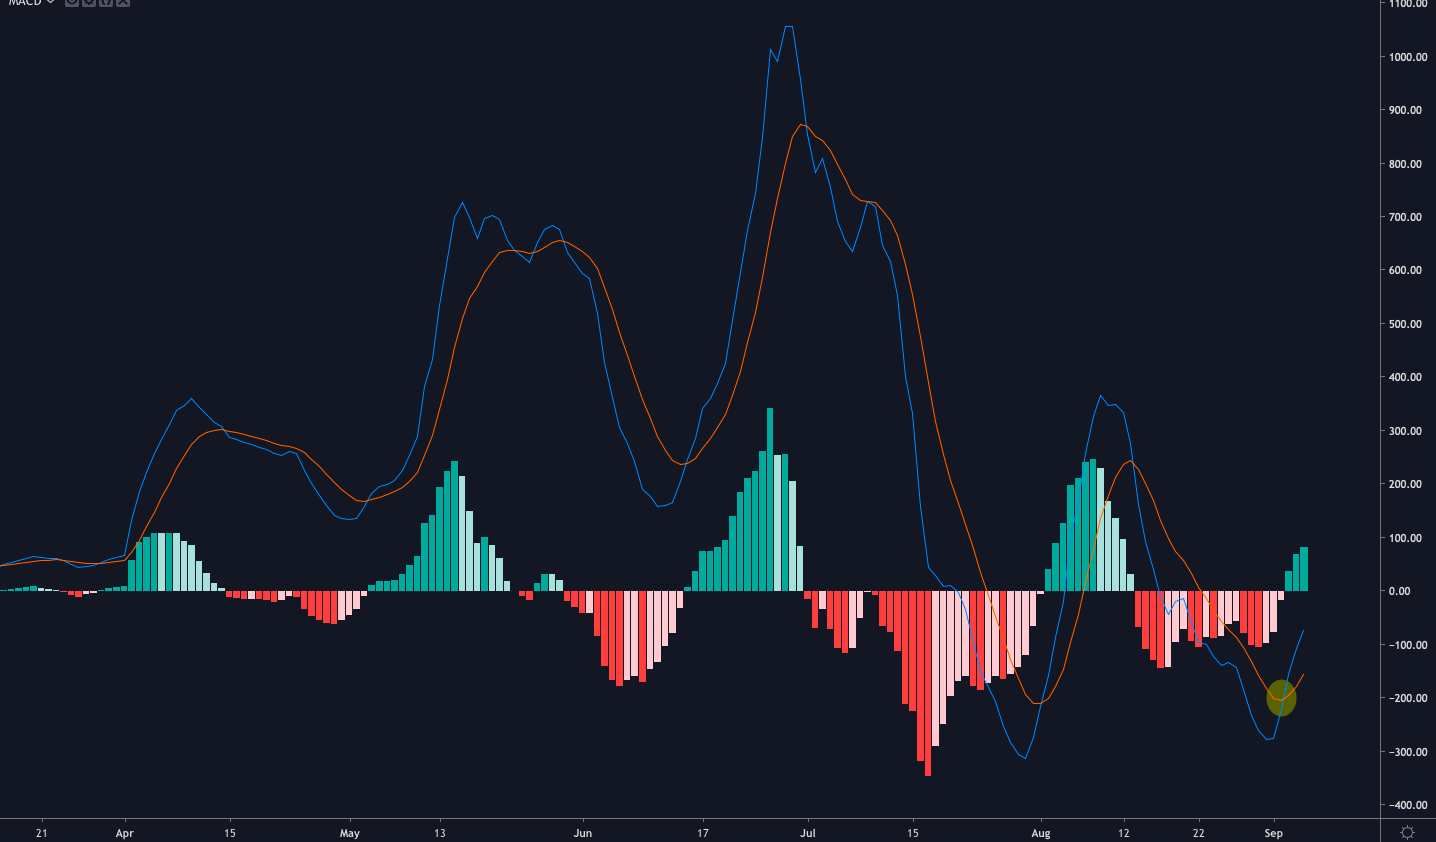
Bitcoin (BTC) trading below or above $10,000 USD is becoming much of a benchmark for bearish and bullish traders respectively. However, zooming out the charts, a very bullish sign appears on the monthly candles.
Since the start of August, the price of Bitcoin has oscillated around the psychological barrier and is currently trading at $9777 USD as at time of writing. The stagnation of BTC’s price below the $10K mark is causing worry across the BTC community but zooming out the charts shows the digital asset is still on a bullish momentum.


Source: TradingView/ KenyanMiner
The $10,000 USD Psychological Barrier
As BTC price started to stumble from its yearly highs of $13,900 USD at the start of August, investors have become more bearish leading to a collapse in price to $9380 USD. However, one cryptocurrency trader and analyst does not believe we are in a bear market yet despite BTC’s price trading below the $10K psychological mark for a week.
His Reasoning?
Since the start of February, the lowest price of BTC Month on Month (MoM) has increased steadily, showing the asset is still in a bull market.


Bitcoin (BTC) lows experiences Month-on-Month growth since February 2019 (Source: Twitter)
The crypto trader, @ProofOfSteve, posted the lowest prices of BTC recorded each month since February on Twitter. With August lowest recorded price at $9380 USD on August 30, this represents a 7 month bullish momentum with July’s lowest point at $9,163 USD. If the $9,000 US mark remains unbroken, the market may push its bullish momentum past the year.
Whenever In doubt, Zoom Out
For a volatile asset such as Bitcoin, looking at the minute, hourly and daily candles can kill your hope for the coin. The massive $4,000 USD+ drop in price since its yearly high price (in less than a month) gives a false impression of an upcoming bearish market.
In times like this, Steve urges investors to zoom out their charts and see the progress BTC is having on a monthly and yearly basis. Willy Woo, a cryptocurrency analyst and partner at Adaptive Capital, shared similar views as he explained Bitcoin’s price touching the 128-day moving average (MA) during massive bullish momentum.


Kissing the 128-day MA: Willy Woo urges investors to buy BTC as it presents a good opportunity for growth. (Source: Twitter)
Zoom Out Bitcoin (BTC) Charts! Monthly Candles Show a Bullish Momentum for Above $10,000 USD
The post appeared first on Crypto Asset Home


